
Inspector for OmniScript
- DevTools panel
- Core and managed packages
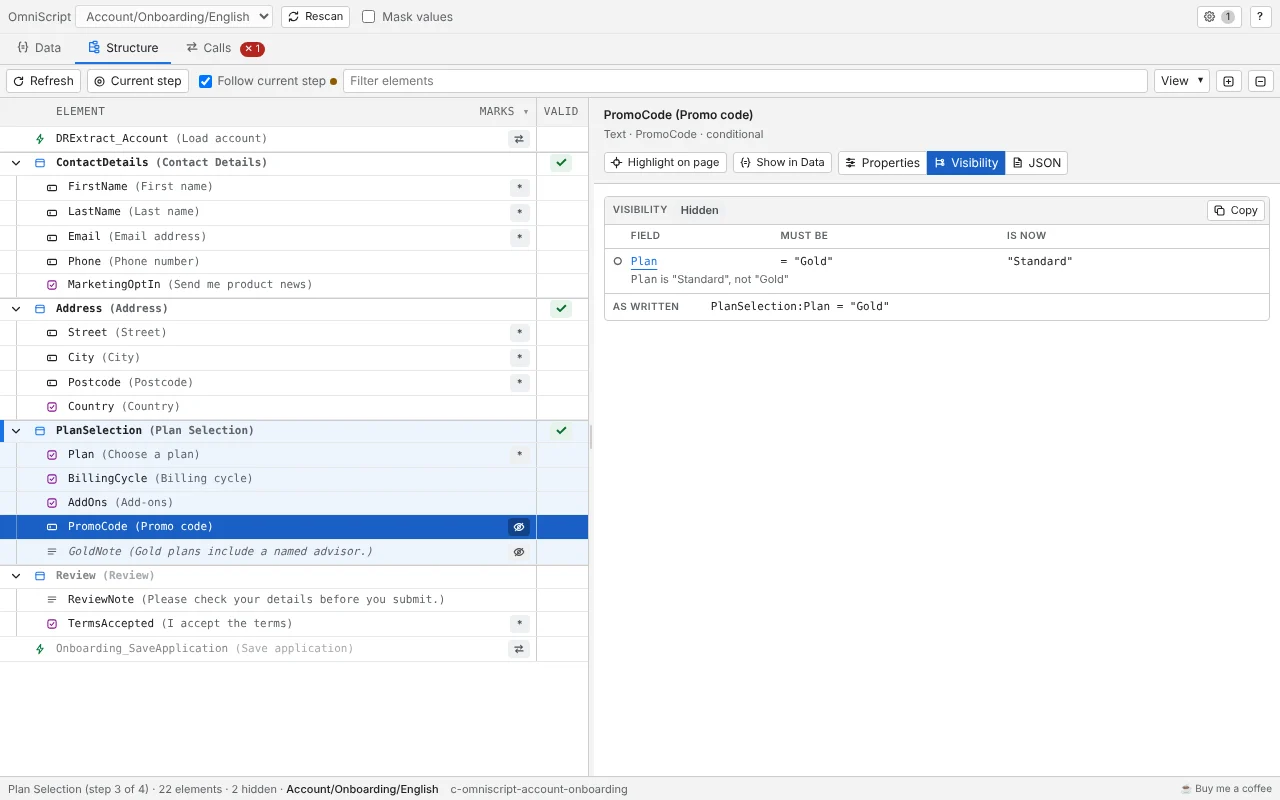
Inspect a running OmniScript in DevTools.
- Find out why a field is hidden.
- See which call failed, and the error in the response.
- See the data change as you move through the OmniScript.


Find the right component, inspect an OmniScript’s live data and see why it behaves the way it does. I build these tools to make everyday OmniStudio development easier.
InspectorDemoThe call returned HTTP 200, but the response holds an error.
{ "success": false,
"error": "No rate found for Standard" } FinderDemo
Showing 3 of 8 components.
Inspect a running OmniScript in DevTools.
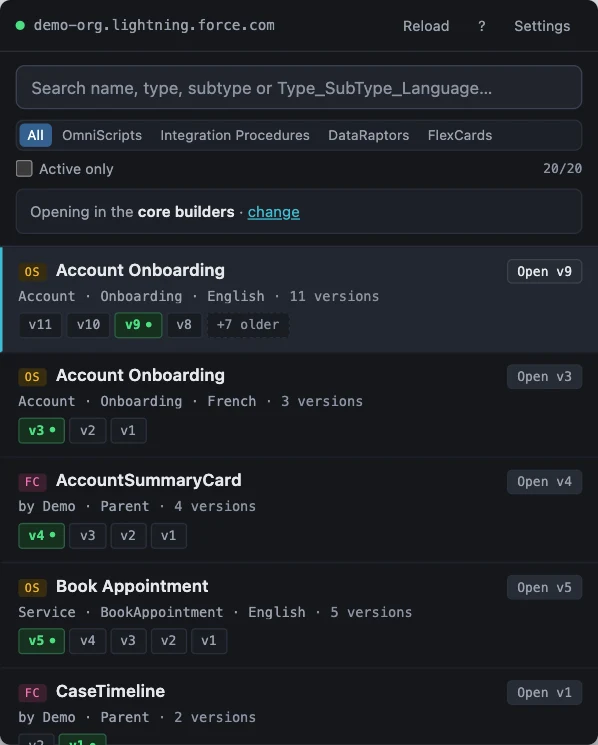
Find OmniStudio components in your Salesforce org.
A few of the everyday questions they answer.
View the OmniScript’s data as a tree, a form or Raw text. Changed values are briefly highlighted.
See the field’s visibility rule alongside the current data values.
See the input and output of each captured call. A failed call is marked even when the error is in the response.
Paste Type_SubType_Language and that component comes first.
Each version has its own chip, and the active one is green. Press Enter to open it in its designer.
I work with OmniStudio every day. Outside work, I build tools for tasks that slow me down: finding the right component, checking an OmniScript’s live data and understanding its behavior.
Add them from the Chrome Web Store. Finder opens from the toolbar, and Inspector is a tab in DevTools.
DevTools panel
Add to Chrome
Toolbar popup
Add to ChromeIf these tools have saved you time or spared you an afternoon of debugging, you can buy me a coffee ☕. Your support helps me keep improving them. Thank you!